There are a few different built in debug toggles that you can use while working in the Editor to help you diagnose events, values, and actions.
How to Debug Dynamic Data on Items
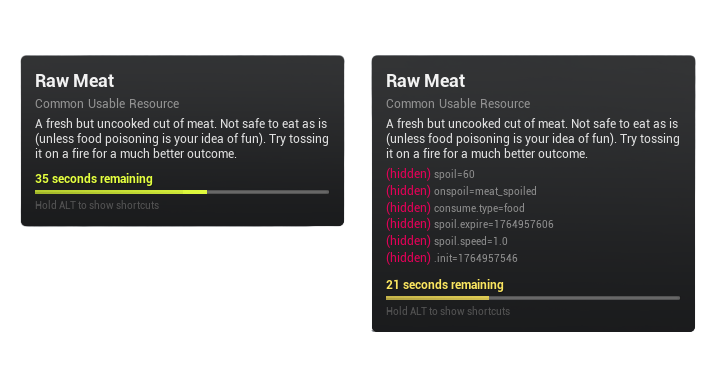
While playing in the editor you can press the IA_InventorySystem_ToggleDebug input action (Default: \ [backslash]) key to toggle showing hidden dynamic data variables and values on the item tooltips. This will temporarily show you all the data on the item, for hidden variables it will show them on the tooltip like: (hidden) variable=value
This is intended to help you debug dynamic data, as when you start using some of the advanced use cases (as described on the dynamic data page) you will want a way to validate the data ending up on the item.
This feature is only available while playing in the editor and is intentionally disabled in packaged builds. Hidden data is data your player shouldn't need to see, but you as a developer might need to see it while working on your project.
Inventory System Debug Text
A number of locations will have a call to a InventoryDebugText function. This is used for debugging different actions and events that occur throughout the system. These are shown as simple print strings on the screen.
You can show these debug strings by setting the EnableInventoryDebugText? boolean local variable inside the function to true. You can find the InventoryDebugText function in the BPFL_InventorySystemV4 blueprint function library found in the Blueprints/Variables/ folder.
It is worth noting that this is not used for all alerts and there are some that will still print with this disabled. Those that do are alerts that are usually a bit more crucial in nature and usually a result of errors where as the debug text is mostly used for warnings and knowing values of certain things at certain times.
Ping Debug Text
The functions related to starting, stopping and handling the onPing event from the dynamic data state events has an additional boolean that can be toggled to show additional Inventory Debug Texts, specific to these ping related actions. You can toggle the value of the debugPing? boolean found inside the AC_Inventory_Storage component to turn these on and off.
Debugging Tips for Beginners
If you're new to debugging in Blueprint, here are a few tools that will save you a lot of time:
Breakpoints
Use breakpoints to check that code is running and to follow its execution flow.
- Right click a node and choose Toggle Breakpoint. A red octagon means it's active.
- When the game hits that node, execution pauses and the editor focuses on that spot.
- Use the toolbar navigation buttons to step through the flow.
- Hover over pins that have already executed to see the values that passed through them.
Find References
Use Find References to see everywhere a variable or function is used.
- Right click a variable or function in Blueprint and select Find References / By Class Member (All).
- This shows every place it's used or called, even in other Blueprints.
Blueprint Debugger
The Blueprint Debugger lets you inspect variable values on each instance of an actor at runtime (it can be resource-heavy).
- In the Viewport, go to Tools / Debug Tools / Blueprint Debugger.
- At runtime, use the dropdown in the debugger panel to pick your Blueprint actor or component.
- You'll see a list of instances; select one to inspect its variables and their current values.